Selected case studies

Housing policy, examined through data and maps

Each case study pairs a policy question with the data, code, and spatial methods used to examine it. Charts and maps appear alongside the analysis so the evidence can be read directly.

Research focus: housing supply, tenure dynamics, regional affordability, and reproducible spatial methods.

Case study 01 · Policy analysis

Housing supply and permitting lag

This analysis examines how permitting timelines relate to new housing supply across metropolitan regions, using administrative permit records and census housing counts to separate supply constraints from demand shifts.

Methods: R data pipelines, panel regression, descriptive comparison of permit-to-completion intervals.


Case study 02 · Mapping

Tenure patterns and geographic disparities

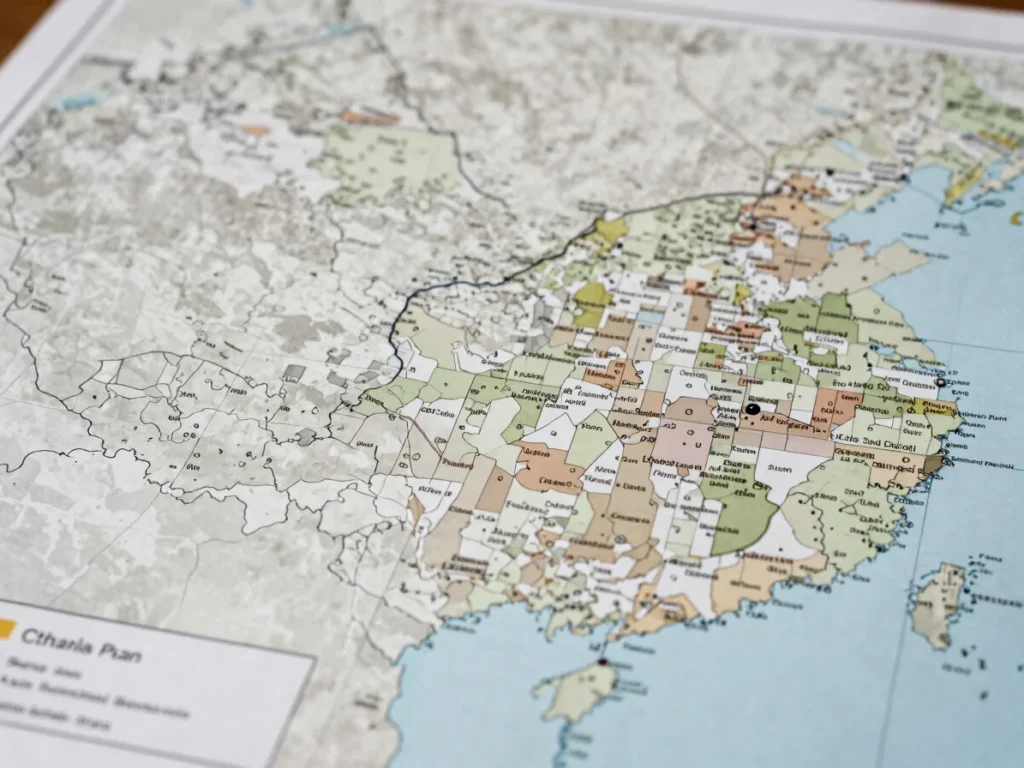
Mapping renter and owner shares at tract level reveals clustering that county summaries obscure. The exhibit shows where tenure composition diverges sharply within the same regional labour market.

Methods: GIS tract-level mapping, spatial join of census tables, choropleth classification.

Case study 03 · Data work

Regional affordability and household burden

Affordability is measured as housing cost burden against local income distributions. The charts compare trends across regions and show where burden concentrates among lower-income renter households.

Methods: data cleaning and harmonisation in R, weighted summary statistics, time-series comparison.

Workflow

From raw intake to policy synthesis

The same sequence informs each case study, so results can be traced back to their inputs.

Raw administrative records are cleaned and documented in scripted R pipelines. Geographic files are standardised and joined to census units. Spatial models and mapped exhibits are then produced from the same versioned inputs. Findings are finally written as policy implications, with limits stated alongside each result.